, 3 min read
Analysis of Performance of Demo Open E-Mobility Site
I analyzed the website performance of Open E-Mobility in Analysis of Website Performance #2. There is a public-facing demo-site to actually view the software in real-time here: Demo. This site looks like this:
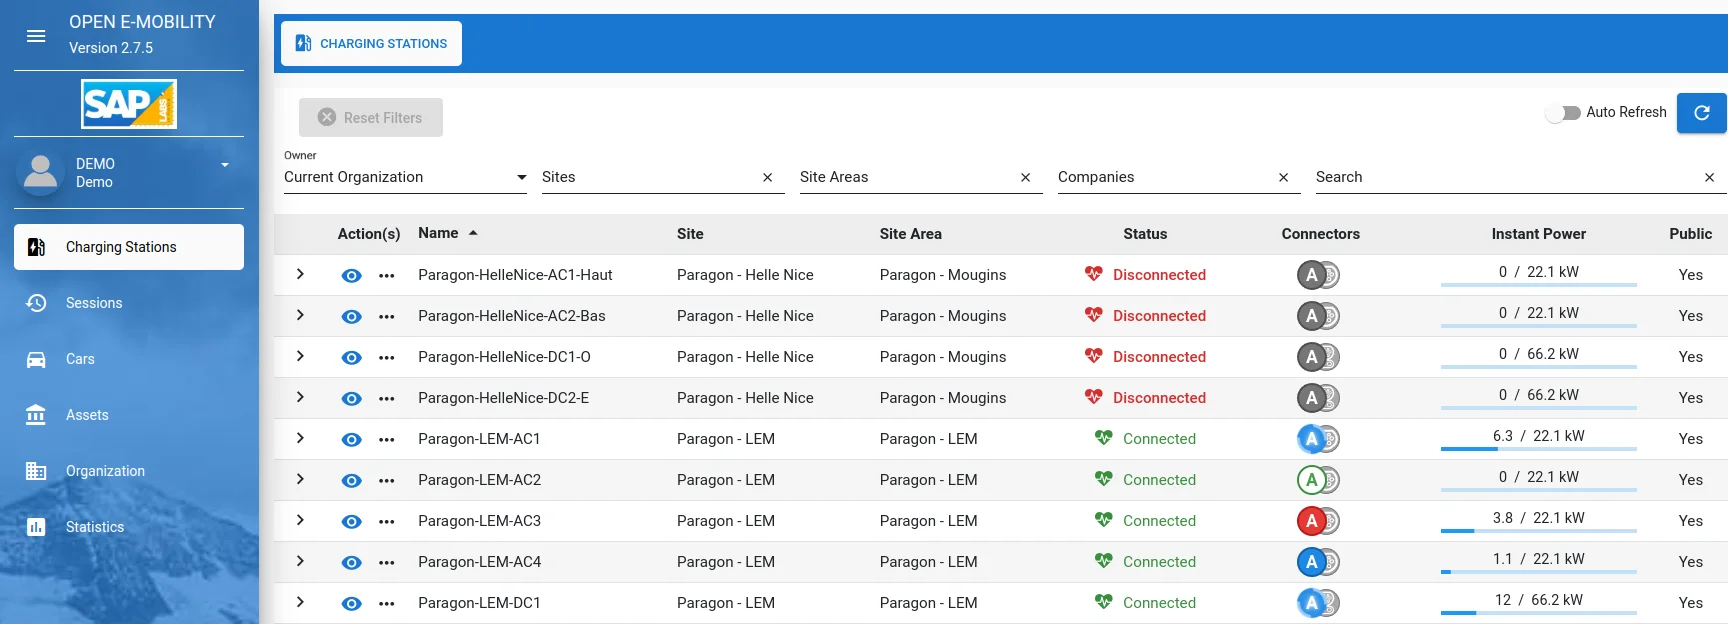
In the following I conduct a black-box analysis. I did not look at the source code of the site. The site is using Angular with TypeScript. The following remarks are only about the performance of this demo-site.
1. Web-server analysis. This demo-site is hosted on AWS, served from Germany. Response time from underlying web-server, NGINX 1.23.3, is according expectation.
$ nslookup 35.156.36.254
254.36.156.35.in-addr.arpa      name = ec2-35-156-36-254.eu-central-1.compute.amazonaws.com.

$ geoiplookup 35.156.36.254
GeoIP Country Edition: DE, Germany

$ time curl "https://slf.e-mobility-labs.com/cars#cars" -o /dev/null
  % Total    % Received % Xferd  Average Speed   Time    Time     Time  Current
                                 Dload  Upload   Total   Spent    Left  Speed
100  9562  100  9562    0     0   115k      0 --:--:-- --:--:-- --:--:--  115k
        real 0.09s
        user 0.02s
        sys 0
        swapped 0
        total space 0
JavaScript is minified. Way more effective than minifying is compressing. It seems this is not activated in NGINX:
$ curl https://slf.e-mobility-labs.com/main.9e010d7729f8f99a.js --silent --write-out "%{size_download}\n" --output /dev/null
2625761
$ curl https://slf.e-mobility-labs.com/main.9e010d7729f8f99a.js --silent -H "Accept-Encoding: gzip,deflate" --write-out "%{size_download}\n" --output /dev/null
2625761
See How can I tell if my server is serving GZipped content?
2. Composition. Important to note is, that the site is an application. This means, once you start it, you are usually supposed to stay on this application for some time. In contrast, a casual website, e.g., weather forecast, news page, etc. you visit and then it is quite normal that you leave. Overall, the demo site does not feel slow. Some statistics on the demo site:
| Type | Measurement |
|---|---|
| Requests | 44 |
| Page size | 8.7 MB |
| Load time | 5.59s (onload 1.15s) |
Below diagram shows that the majority of the site consists of JavaScript and CSS, as given by developer tools in Google Chrome:
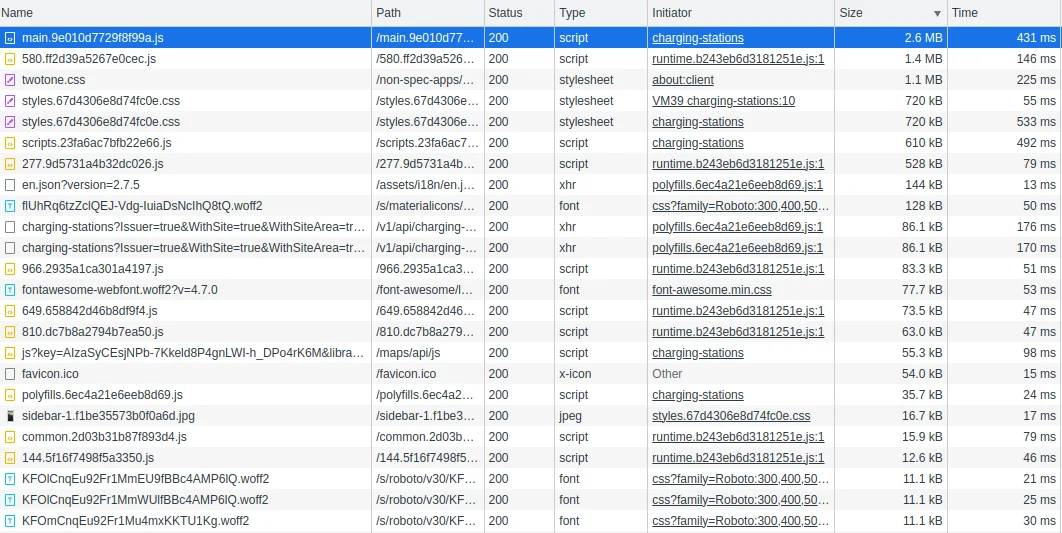
One thing noticeable is that static content, like images do not have an expiry. If images are not generated, then they should usually have an expiry date, so the browser knows when to reload. But they do contain etags.
The sites make references to the following external sites:
- https://maxcdn.bootstrapcdn.com
- https://maps.googleapis.com
- https://fonts.googleapis.com
- https://fonts.gstatic.com
After first request the majority of elements are cached in the browser, so only 15 requests are made in subsequent requests.
3. Uncached files. Two requested files are not found, i.e., they return 404 error code:

These two files should be easy to avoid, sparing ca. 100 ms of unnecessary load time.
Switching between the menu items "Cars" and "Assets" leads to re-requesting all images, even though they are cached, but the browser does not know their expiry time:

This can be avoided by keeping all "assets", i.e., car images, in local storage, and then accessing them from there via JavaScript. Only when a new car shows up during runtime, can the cache in local storage be replenished. The advantage is not avoiding page size but number of requests, which are pretty high. Each of those unnecessary requests needs roughly 100-300 ms. Also worth double checking whether all these images are URL-stable, i.e., do not change their name (including all their parameters).

From har-viewer:
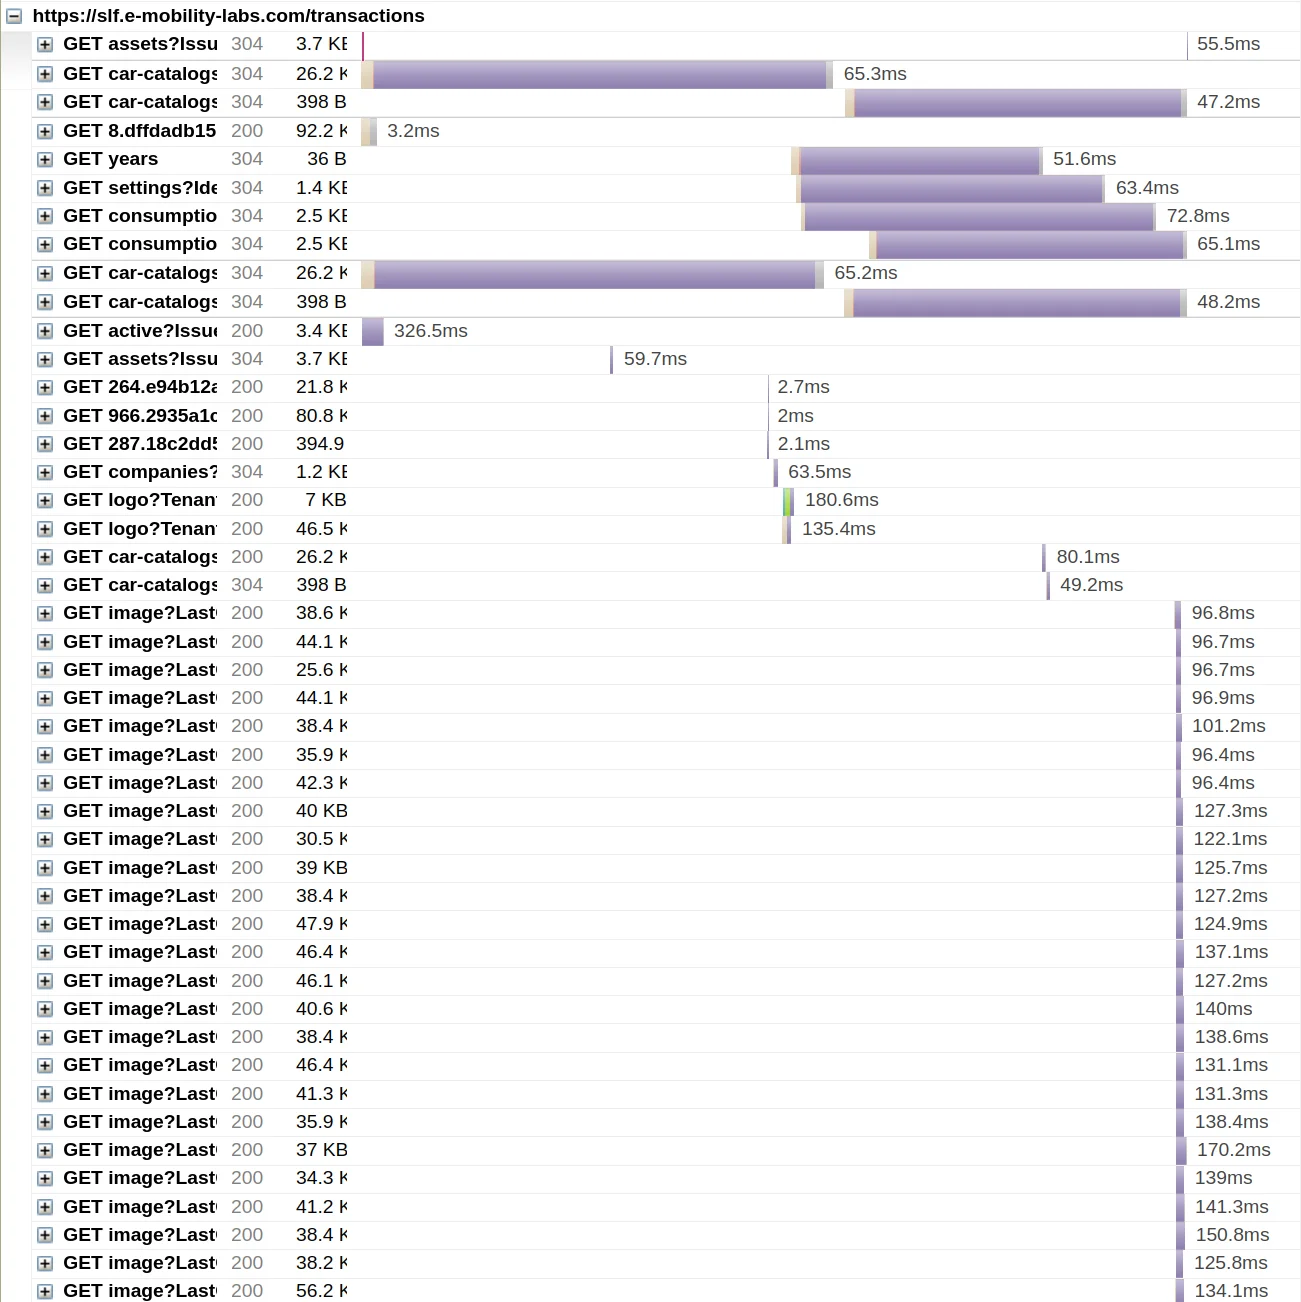
Similar observations hold for car-catalogs?Limit=50&SortFields=vehicleMake. This likely can be stored in local storage and then reused, instead of reloading over and over again. This item is on the critical path. Similarly for:
charging-stations?Issuer=true& ... =true&Limit=50&SortFields=id.active?Issuer=true&WithCompany=true& ... =50&SortFields=-timestamp