, 2 min read
Plotting Power Consumption of my Desktop PC
I own a desktop PC with an AMD octacore FX 8120 and a NVidia GTX 560 graphic card running GPUGrid. What is the power consumption in Watts over time?
I ran
( while true; do powerconsum ; sleep 2; done ) &
with below script powerconsum reading data from sensors:
#!/usr/bin/perl -W
use strict;
my (@F,$power1,$temp1,$i);

open(IN,"sensors |") || die("Cannot run sensors");
open(OUT,">> /some/file") || die("Cannot append to file");

$i = 0;
while (<IN>) {
        if (/^power1:/) {
                @F = split;
                $power1 = $F[1];
                ++$i;
        } elsif (/^temp1:.*thermistor$/) {
                @F = split;
                $temp1 = $F[1];
                $temp1 =~ s/\+//g;
                $temp1 = substr($temp1,0,length($temp1)-3);
                ++$i;
        }
}
close(IN) || die("Cannot close pipe");
if ($i == 2) {
        print OUT "$power1\t$temp1\n";
} else {
        print OUT "sensor output invalid\n";
}
close(OUT) || die("Cannot close output file");
Program sensors is in lm-sensors in Ubuntu.
Running above script over the day, produces quite a mass of data (20-45.000 entries per day), unsuitable for direct plotting. So I applied a moving average on it. Unfortunately, I didn't find one in Octave, although present in MATLAB, so I used below Perl script for this:
#!/usr/bin/perl -W
# Calculate moving average of time series.
# Program can take arguments:
#     -d             debug flag
#     -n <numeric>   number of averages, default is 5

use Getopt::Std;
my %opts = ('d' => 0, 'n' => 0);
getopts('dn:',\%opts);

my ($i,$j,$n,$cols,@sum,@F,@mat) = (0,0,0,0,(),(),());
$n = (($opts{'n'} > 0) ? $opts{'n'} : 5);

while (<>) {
        @F = split;
        $cols = $#F;
        for ($j=0; $j<=$cols; ++$j) {
                $sum[$j] += $F[$j];
                $sum[$j] -= $mat[$i%$n][$j] if ($i >= $n);
                $mat[$i%$n][$j] = $F[$j];
        }
        if ($i >= $n) {
                for ($j=0; $j<=$cols; ++$j) {
                        my $mvavg = $sum[$j] / (1.0 * $n);
                        printf("$mvavg%s", ($j < $cols) ? "\t" : "\n");
                }
        }
        ++$i;
}
I highlighted the statements for actual moving average computation.
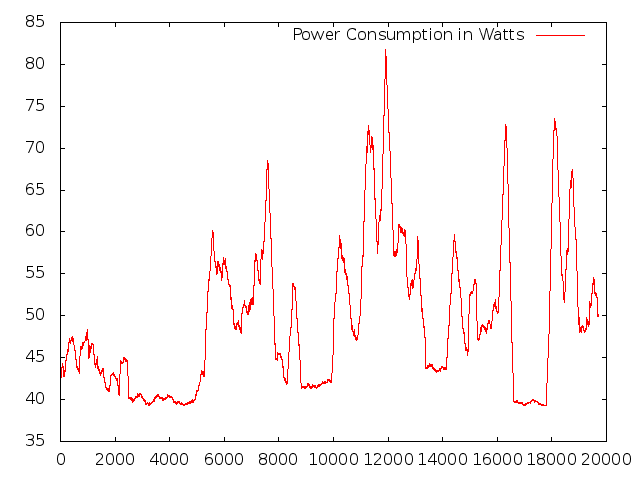
Chart looks like this, spikes usually mean YouTube video watching. Without that my PC usually consumes around 40 Watts, happily crunching numbers for GPUGrid:
Or see power consumption chart for another day:
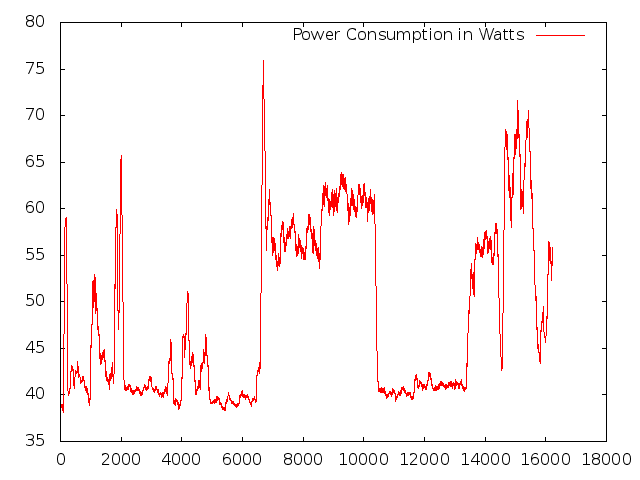
Above charts were produced with
mvaverag -n300 /some/file | gnuplot -e "set terminal png; set output '/some/png-file'; plot '-' using 1 with lines title 'Power Consumption in Watts'"
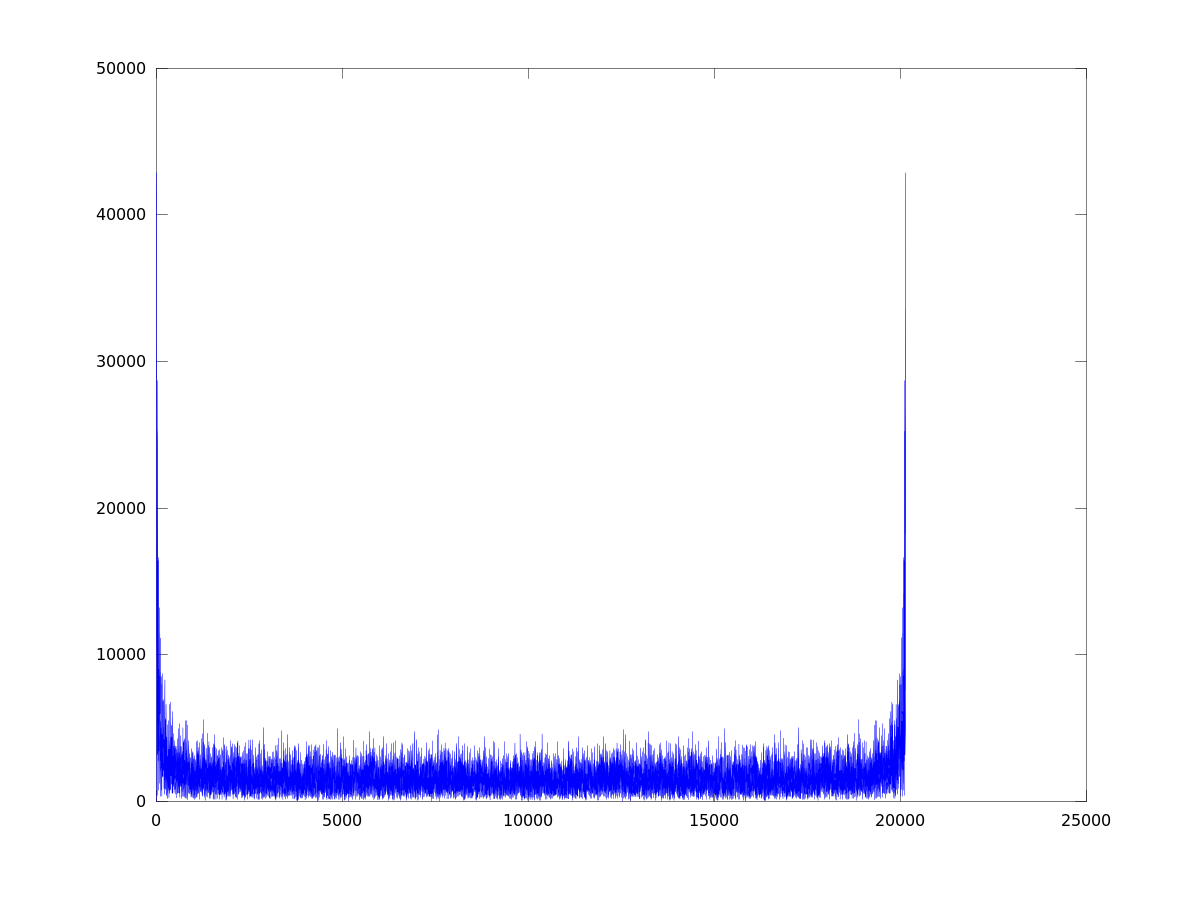
I wanted to know whether there are some predominant frequencies in the data, so I moved to frequency domain via discrete Fourier transform using MATLAB/Octave employing fft.
plot( abs(fft(detrend( dlmread("/some/file")(:,1)) )) )
It looks like there isn't really, see frequency diagram below.