, 4 min read
Parallelization and CPU Cache Overflow
In the post Rewriting Perl to plain C the runtime of the serial runs were reported. As expected the C program was a lot faster than the Perl script. Now running programs in parallel showed two unexpected behaviours: (1) more parallelizations can degrade runtime, and (2) running unoptimized programs can be faster.
See also CPU Usage Time Is Dependant on Load.
In the following we use the C program siriusDynCall and the Perl script siriusDynUpro, which was described in above mentioned post. The program or scripts reads roughly 3GB of data. Before starting the program or script all this data has been already read into memory by using something like wc or grep.
1. AMD Processor. Running 8 parallel instances, s=size=8, p=partition=1(1)8:
for i in 1 2 3 4 5 6 7 8; do time siriusDynCall -p$i -s8 * > ../resultCp$i & done
real 50.85s
user 50.01s
sys 0
Merging the results with the sort command takes a negligible amount of time
sort -m -t, -k3.1 resultCp* > resultCmerged
Best results are obtained when running just s=4 instances in parallel:
$ for i in 1 2 3 4 ; do /bin/time -p siriusDynCall -p$i -s4 * > ../dyn4413c1p$i & done
real 33.68
user 32.48
sys 1.18
$ for i in `seq 1 12`; do for j in `seq 1 $i`; do echo "i=$i, j=$j" >> ~/tmp/runtime; /bin/time -pao ~/tmp/runtime siriusDynCall -s$i -p$j * > ../resultC.$i.$j & done; wait ; done
leads to the following diagram
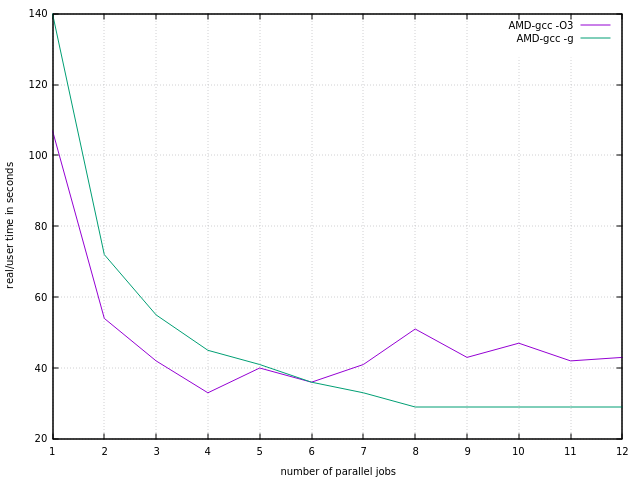
Depicted times are "real"-times, as given by /bin/time command. Real and user times are very similar, so they are not shown separately.
So on a 8-core AMD Bulldozer CPU one should use 4 cores, and runtime is improved by a factor of 4. AMD FX-8120 is not in all instances a full 8 core CPU, see AMD Bulldozer CPU Architecture Overview. Also see Output of lstopo from hwloc. In our case we clearly see that sharing L2-cache among each two CPU cores has a remarkable effect. The same holds true for i7-6600U with its L1 and L2 caches which are shared among each two CPU cores. So on Intel i5 and i7 halfing processing time is the best you can achieve with this type of programs.
Therefore on an AMD Bulldozer running the program in parallel only leads to halfing in runtime when using size s=8. The same effect is true for the Perl script running on an HP EliteBook notebook, i.e., four hyperthreading Intel cores only half the runtime.
The C program was compiled with full optimization enabled:
$ cc -Wall -O3 -march=native siriusDynCall.c -o siriusDynCall
gcc is version 7.2.1 20171128. When not using optimization then run time increases by 40s to 146s in total, i.e., an increase by ca. 33% for serial execution.
For curiosity I compiled with debug option:
cc -Wall -g -pg -no-pie siriusDynCall.c -o siriusDynCall
The diagram above shows that at parallelization degree 5 the fully optimized programs gets slower, while the debugged program still gets faster. This was totally unexpected. It is assumed that the fast optimized program is fully draining the L2-cache and after that all parallel processes fiercely competing for new data, which slowly comes along. While the slow debugged program always finds enough data in L2-cache ready to be processed.
2. Intel Processor. The same procedure for Intel i7, one time compiled with full optimization, the other time compiled with debug and profile option.
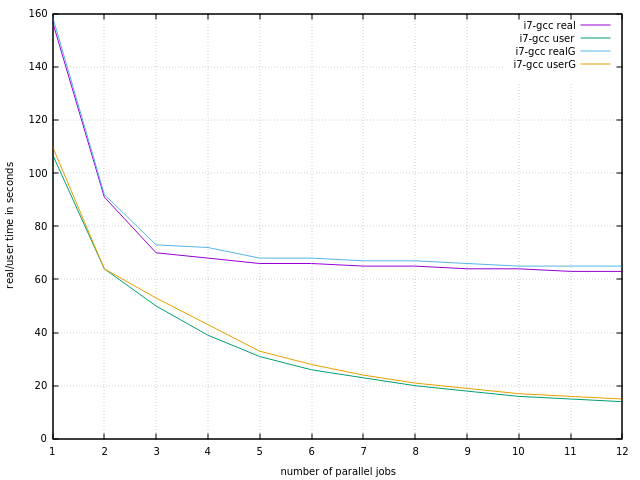
What is striking is that user time is significantly less than real time. For AMD FX-8120 there was more or less no difference. Furthermore, as in the AMD-case, there is no relevant difference between optimized and debugged version.
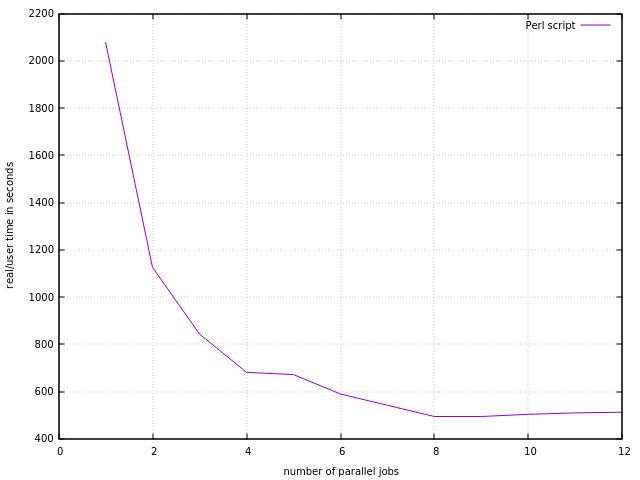
3. Running Perl. On AMD Bulldozer: Running the Perl script eightfold in parallel takes 8 minutes, so run time is divided by a factor of 6.
$ for i in 1 2 3 4 5 6 7 8; do time siriusDynUpro -p$i -s8 * > ../resultPerl$i & done
real 490.02s
user 485.98s
sys 0
swapped 0
total space 0
I.e., 490s=8m. This is almost 15-times slower than the parallel version of the C program.
Running the Perl script fourfold in parallel takes 12 minutes. In line with the L2-cache remark we assume that Perl is CPU bound, while the C program is I/O bound, eager to eat more data. Trying all possibilities for parallelization for the Perl script gives:
4. Related work. For similar findings regarding parallel execution see Running bacman in parallel, where xz was the bottleneck.
Parallelization via partitioning in C in main():
// process all files from command line
for (i=optind; i<argc; ++i)="" {="" if="" (hashlookup(pgmhash,argv[i]))="" continue;="" (part="" &&="" partsize="" (i="" -="" optind)="" %="" !="part-1)" [="" code]="" parallelization="" via="" partitioning="" in="" perl:="" [code="" lang="Perl" ]="" while="" () {
next if (defined($pgmHash{$_}));
next if ($partition != 0  &&  $partsize != 0  &&  $i++ % $partsize != $partition - 1);
5. Plotting. Gnuplot was used for the diagrams. The following script siriusPlot:
#!/bin/gnuplot -c
# gnuplot commands:
#     arg1 = file name with data
#     arg2 = prefix of title

set style data line
set grid
set xlabel 'number of parallel jobs'
set ylabel 'real/user time in seconds'

plot for [i=2:*] ARG1 using 1:i:xticlabels(1) with lines title ARG2." ".columnhead(i)
pause -1
was called using
siriusPlot runtimeDynCallElitebook.dat i7-gcc