, 4 min read
Analysis of Website Performance #2
1. Problem statement. Analyse website performance of Open E-Mobility site. I had written on website performance and measurement here:
- Speed-Tests with Pingdom.com
- Bandwith Diet for This Blog
- Accelerating Page Load Times by Reducing Requests
- Accelerating Page Load Times by Reducing Requests, Part #2
- Analysis of Website Performance
The overall lessons were:
- Measure your website performance
- Reduce content size (mostly CSS and JavaScript)
- Reduce image size by using modern file formats, e.g., WebP
- Reduce number of requests
Open E-Mobility is a website about a software solution for multiple charging stations, even charging stations dispersed in multiple different locations. The software optimizes costs, distributes currency under power constraints, if any.
Open E-Mobility is a website made with WordPress 6.0.2, PHP 7.4.33, running on Apache web-server. The site is hosted by 1&1 ("Ionos"). The site is responsive, i.e., adapts to different screen sizes, thereby also changing what is shown. Media queries are at 782px, 600px, and other. It was built using Avada Website Builder. It uses Google Tag Manager. It provides a RSS-feed. The site is offered in French, German and English. Rough counting shows at least 11 pages, and 9 blog posts. That is at least (11+9)*3=60 pages/posts.
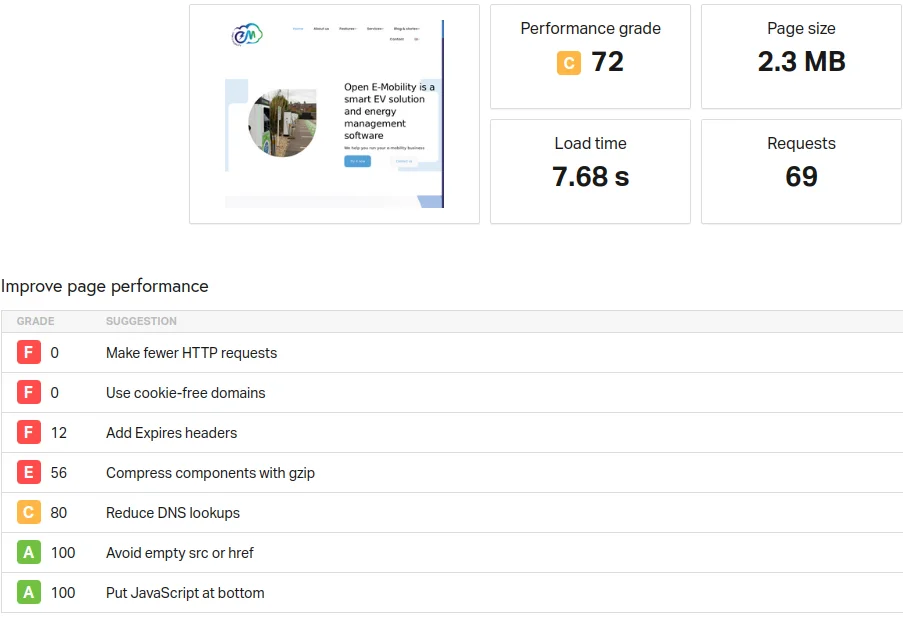
2. Measurements. DNS lookup of open-e-mobility.io using nslookup shows no indications of performance problems with DNS. I now checked open-e-mobility.io from different locations using tools.pingdom.com.
| Location | Performance grade | Page size | Load time | Requests |
|---|---|---|---|---|
| Frankfurt | C 72 | 2.3 MB | 1.78 s | 69 |
| Washington (D.C.) | C 72 | 2.3 MB | 3.20 s | 69 |
| Sydney (Australia) | C 72 | 2.3 MB | 7.68 s | 69 |
| São Paulo | C 72 | 2.3 MB | 5.42 s | 69 |
Measuring with tools.pingdom.com for Sydney for "https://open-e-mobility.io". The more far away from Frankfurt (Germany), performance degrades significantly.
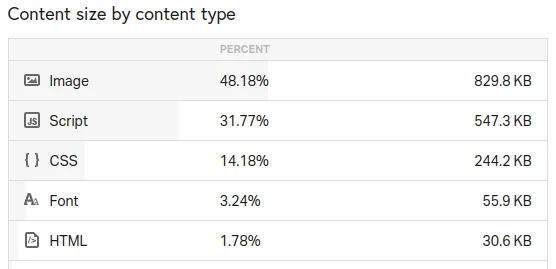
Breakdown according content-type:
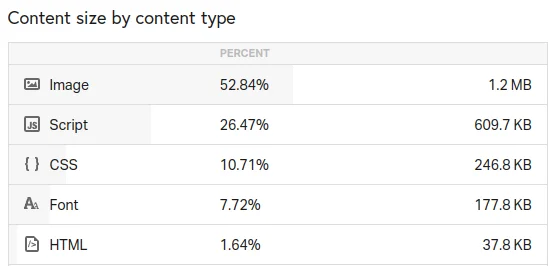
This shows that images and JavaScript make the bulk of the page.
Digging deeper into that using the har.json from pingdom.com and uploading to har-viewer.
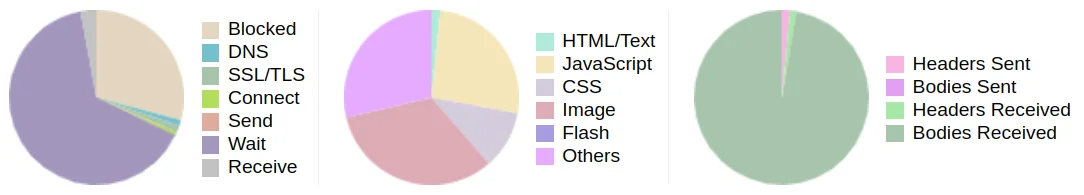
Timeline is:
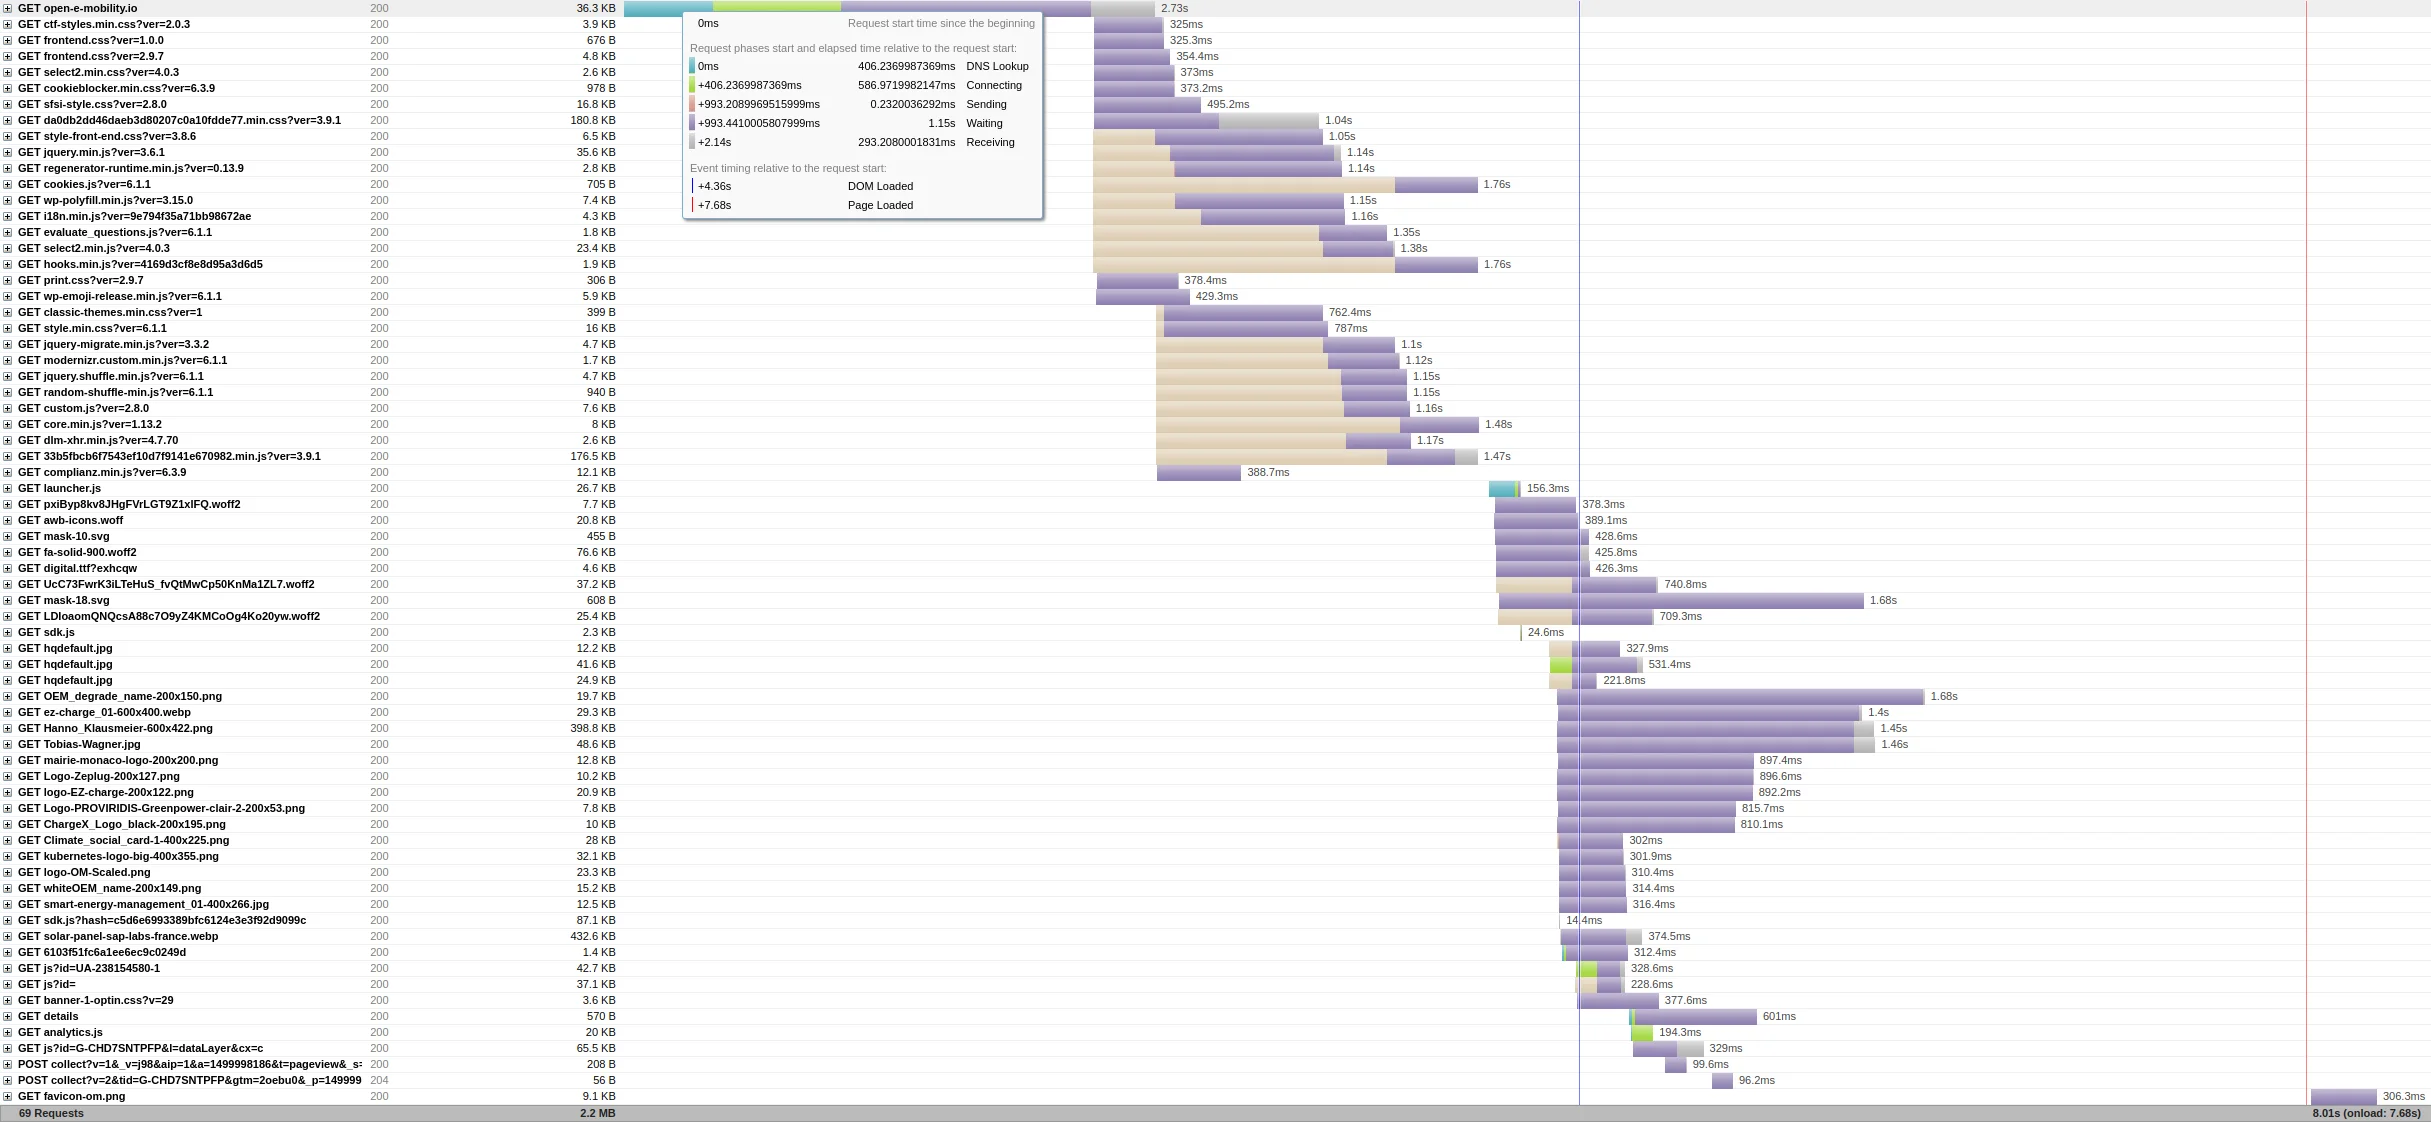
Much time is clearly wasted for just waiting. Waiting, though, is not caused by the Apache web-server:
$ time curl https://open-e-mobility.io/wp-content/uploads/2022/08/Tobias-Wagner.jpg -o wagner.jpg
  % Total    % Received % Xferd  Average Speed   Time    Time     Time  Current
                                 Dload  Upload   Total   Spent    Left  Speed
100 49515  100 49515    0     0   121k      0 --:--:-- --:--:-- --:--:--  121k
        real 0.41s
        user 0.04s
        sys 0
        swapped 0
        total space 0
So downloading a specific file from the site proceeds quickly. This indicates that WordPress and/or MySQL are not doing a good job here.
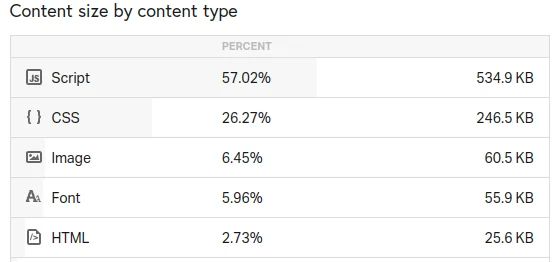
Above analysis was for the home-page of open-e-mobility, which contains a number of embedded videos. But even a blog post, requires a huge number of requests. See for example, The future of EV charging is large scale optimization. This has grade C 75, page size is 1.7 MB, load time for Frankfurt is 2.47 s, requiring 54 requests. Breakdown of content-types is:
Even when going extreme, and just surfing a text-only page, here Website terms and conditions, grade is C 75, page size is 938.1 KB, load time is 3.65 s, number of requests are 49. This is for Frankfurt. Such a simple page should reach grade A 100. Clearly, JavaScript is ruining the performance.
4. Remedy. Below is a list of possible cures for tuning the performance.
- Use a static site generator. This would reduce the waiting time for WordPress/PHP/MySQL. One could use Simplified Saaze.
- Another route to reduce waiting time, would be to try to use a Varnish HTTP Cache.
- Needing 69 HTTP requests for a single page clearly indicates that a "request diet" would also be highly beneficial.
- Use a CDN to cache content for access points far away from Frankfurt. One particular well-known CDN is for example Cloudflare.
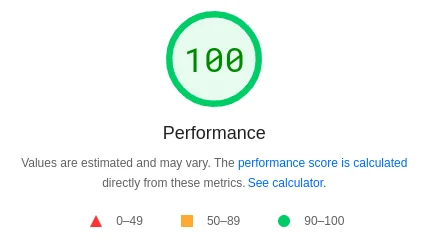
5. Google Lighthouse Measurements. To confirm the findings with pingdom.com, here are the results when measuring with Google Lighthouse.
Below is the overall performance.
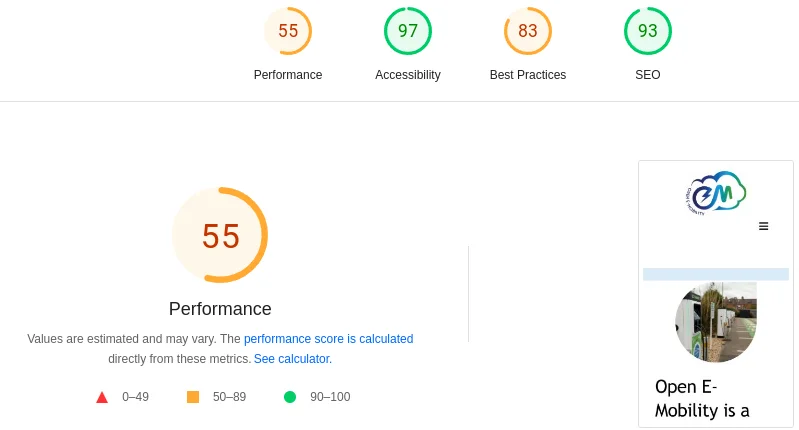
One can clearly see, that the page loads slowly: Only after 3 seconds there is "something" on the screen, and only after more than 8 seconds the page is fully interactive on a mobile device.
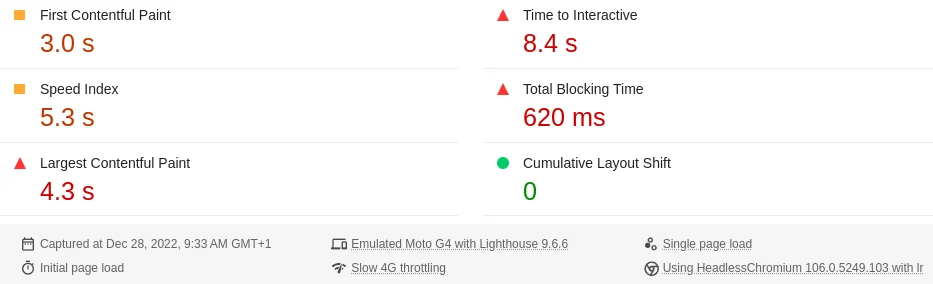
Similar to the pingdom findings, JavaScript is one of the major bottlenecks.
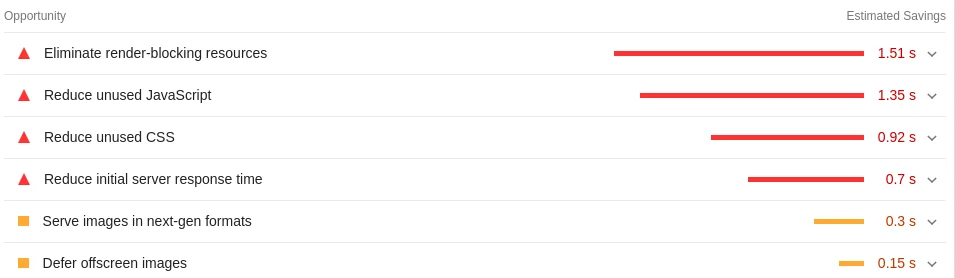
To give an example: On a text-only web-page you should aim for this: