, 1 min read
Graphs with JpGraph by Asial
JpGraph is a library of PHP code to draw a variety of graphs:
- line+bar+pie charts
- radar+polar+contour graphs
- bar+QR codes
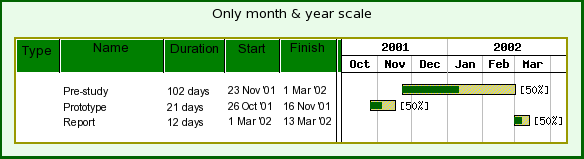
- Gantt charts
- a couple of other chart types
Here are two examples:
JpGraph is a free product by Asial if used in a non-commercial context.
Installation is quite easy on Ubuntu because all the software can readily be installed by apt-get. You need:
After installing php5-gd restart the web-server. Failing to do so will make JpGraph fail.
Unpack JpGraph in your web directory, i.e., /var/www.
cd /var/www
tar zxf ~/Downloads/jpgraph-3.5.0b1.tar.gz
mv jpgraph-3.5.0b1/src/ .
mv src/ jpgraph
ln -s jpgraph-3.5.0b1/docs/ jpgraph-doc
To work around the font problem either use
DEFINE("TTF_DIR","/usr/share/fonts/truetype/ttf-bitstream-vera/");
in the beginning of your PHP code, or change TTF_DIR in jpg-config.inc.php
Google Charts lacks support for Gantt charts, although it supports timelines. Google Charts is based upon JavaScript, while JpGraph is based upon PHP.
Added 01-Mar-2017: In Arch Linux you install php-gd, and ttf-ms-fonts (AUR). In /etc/php/php.ini you uncomment gd.so.